
 U.S. Department of Health and Human Services
Food and Drug Administration
The AEMS public dashboard is a new, user-friendly and interactive web-based tool that was created to give the public the ability to query the FDA AEMS database and improve transparency. The data presented in the AEMS public dashboard has several key limitations. The existence of adverse event reports for a drug or biologic in AEMS does not mean that the drug or biologic caused the adverse event. Importantly, the AEMS data is not an indicator of the safety profile of the drug or biologic. For more information, please refer to the question What points should I consider while viewing the dashboard content?
Frequently Asked Questions (FAQs)
Expand all | Collapse all
The FDA Adverse Event Monitoring System (AEMS) is a database that contains adverse event reports, medication error reports and product quality complaints resulting in adverse events that were submitted to FDA. The database is designed to support the FDA's post-marketing safety surveillance program for drug and therapeutic biologic products. The informatic structure of the AEMS database adheres to the international safety reporting guidance issued by the International Conference on Harmonisation (ICH E2B). Adverse events and medication errors are coded using terms in the Medical Dictionary for Regulatory Activities (MedDRA) terminology.
+ How does FDA use the information in AEMS?
AEMS is a useful tool for FDA for activities such as looking for new safety concerns that might be related to a marketed product, evaluating a manufacturer's compliance to reporting regulations and responding to outside requests for information. The reports in AEMS are evaluated by clinical reviewers, in the Center for Drug Evaluation and Research (CDER) and the Center for Biologics Evaluation and Research (CBER), to monitor the safety of products after they are approved by FDA.
If a potential safety concern is identified in AEMS, further evaluation is performed. Further evaluation might include conducting studies using other large databases, such as those available in the Sentinel System. Based on an evaluation of the potential safety concern, FDA may take regulatory action(s) to improve product safety and protect the public health, such as updating a product’s labeling information, restricting the use of the drug, communicating new safety information to the public, or, in rare cases, removing a product from the market.
Healthcare professionals, consumers, and manufacturers submit reports to AEMS. FDA receives voluntary reports directly from healthcare professionals (such as physicians, pharmacists, nurses and others) and consumers (such as patients, family members, lawyers and others). Healthcare professionals and consumers may also report to the products’ manufacturers. If a manufacturer receives a report from a healthcare professional or consumer, it is required to send the report to FDA as specified by regulations.
+ How can I report an adverse event or medication error to FDA?
The MedWatch website provides information about voluntary and mandatory reporting.
+ Can mandatory reporters submit adverse events electronically?
Yes, the FDA Adverse Events Monitoring System (AEMS) Electronic Submissions website provides drug and therapeutic biological product manufacturers, distributors, packers, and other interested parties with information about FDA Adverse Event Monitoring System (AEMS) electronic submissions and instructions on how to electronically submit post-marketing individual case safety reports (ICSRs), with and without attachments.
+ Does AEMS data have limitations?
Yes, AEMS data does have limitations. First, there is no certainty that the reported event (adverse event or medication error) was due to the product. FDA does not require that a causal relationship between a product and event be proven, and reports do not always contain enough detail to properly evaluate an event. Furthermore, FDA does not receive reports for every adverse event or medication error that occurs with a product. Many factors can influence whether an event will be reported, such as the time a product has been marketed and publicity about an event. There are also duplicate reports where the same report was submitted by a consumer and by the sponsor. Therefore, AEMS data cannot be used to calculate the incidence of an adverse event or medication error in the U.S. population. For more information, please refer to the question What points should I consider while viewing the dashboard content?
+ Is AEMS data available to the public?
AEMS data is available to the public in the following ways:
· AEMS dashboard: a highly interactive web-based tool that allows for the querying of AEMS data in a user friendly fashion.
· AEMS data files: provides raw data consisting of individual case safety reports extracted from the AEMS database. A simple search of AEMS data cannot be performed with these files by persons who are not familiar with the creation of relational databases.
· Individual case safety reports from the AEMS database can also be obtained by sending a Freedom of Information (FOI) request to FDA.
+ How do I find or confirm my report is in AEMS?
To confirm that your report is in AEMS, please send a Freedom of Information (FOI) request to FDA.
+ What are the benefits of the AEMS public dashboard?
This tool makes the data easier to query and produces user-friendly information and charts. For example, users can view a summary of adverse event reports received from 1968 to the present or for a specific timeframe. In addition, users can search for products or reactions of interest within a specific timeframe.
+ Will there be a tutorial so I can learn how to use this database?
Yes, a recorded webinar is available which reviews the capabilities, and limitations, of the AEMS public dashboard.
Please note that a new webinar addressing the version 2.0 updates to the AEMS Public dashboard will be available soon.
+ Is the AEMS public dashboard accessible on an Android™ or iPhone®?
Yes, but the user interface layout may not be very user friendly. FDA will continue to work on the dashboard to make the user interface Android and iPhone friendly.
+ Can I download my search results from the dashboard?
Yes, you will be able to export a limited set of search data to an Excel® spreadsheet and then download it. FDA will still continue to provide the AEMS Latest Quarterly Data Files online.
+ Where else can I find safety information?
· Potential Signals of Serious Risks/New Safety Information Identified from the FDA Adverse Event Monitoring System (AEMS): quarterly reports on potential serious side effects identified by AEMS.
· Post-marketing Drug and Biologic Safety Evaluations: provides summary information about ongoing and completed post-marketing safety evaluations of adverse experience reports made to FDA for New Drug Applications (NDAs) and Biologic License Applications (BLAs) approved since September 27, 2007.
· Center for Drug Evaluation and Research (CDER): Drug Safety and Availability
· Post-market Drug Safety Information for Patients and Providers
· MedWatch: The FDA Safety Information and Adverse Event Monitoring Program
+ How are versions of a case in AEMS handled?
Each unique submission of a case received is assigned a version number (for example, Case #1234567, version 1). The initial version received will be version 1. If a follow up is received on a previously submitted case, then that version of the case will be version 2, and so on. The latest version of a case represents the most current information about that case.
+ How frequently is the data in the AEMS public dashboard updated?
The data is updated daily (near real-time).
+ What points should I consider while viewing the dashboard content?
When you view the website output of reported reactions (side effects or adverse drug reactions) for a drug product, it is important to consider the following points:
- Data Quality: There are many instances of duplicative reports and some reports do not contain all the necessary information. Duplicate reporting occurs when the same report is submitted by the consumer and the sponsor. The information in AEMS evolves daily and the number of individual cases may increase or decrease. It is therefore possible that the information on this website may change over time.
- Existence of a report does not establish causation: For any given report, there is no certainty that a suspected drug caused the reaction. While consumers and healthcare professionals are encouraged to report adverse events, the reaction may have been related to the underlying disease being treated, or caused by some other drug being taken concurrently, or occurred for other reasons. The information in these reports reflects only the reporter's observations and opinions.
- Information in reports has not been verified: Submission of a report does not mean that the information included in it has been medically confirmed nor is it necessarily a conclusion from the reporter that the drug caused or contributed to the event.
- Rates of occurrence cannot be established with reports: The number of suspected reactions in AEMS should not be used to determine the likelihood of a side effect occurring. The FDA does not receive reports for every adverse event or medication error that occurs with a product. Many factors can influence whether an event will be reported, such as the time a product has been marketed and publicity about an event. Therefore, information in these reports cannot be used to estimate the incidence (occurrence rates) of the reactions reported.
- Patients should talk to their doctor before stopping or changing how they take their medications.
- Patient Outcomes received in AEMS: These data describe the outcome of the patient as defined in U.S. reporting regulations (21 CFR 310.305, 314.80, 314.98, 600.80). Serious means that one or more of the following outcomes were documented in the report: death, hospitalization, life-threatening, disability, congenital anomaly, and/or other serious outcome. Documenting one or more of these outcomes in a report does not necessarily mean that the suspect product(s) named in the report was the cause of the outcomes.
Importantly, the AEMS data by themselves are not an indicator of the safety profile of the drug.
Data Questions
+ How do I know if a side effect I saw on the dashboard is related to the drug I was taking?
The best sources of information for the known side effects of a drug are the FDA approved product information (also known as full prescribing information or US package insert) and your health care provider. This dashboard tells you what was reported to the FDA, but it is difficult to know what caused a particular event in a particular patient from the information on the dashboard. Even if a symptom is a known side effect for a drug, it can be difficult to know if the symptom that a patient had was caused by a particular drug, since there may be other possible causes as well. For example, some medications cause headaches, but many people have headaches even when they aren’t on any medications.
+ If an adverse event wasn’t caused by a drug, what could have caused it?
Although some adverse events can be caused by a drug, there are also other possible explanations for symptoms that appear while a patient is taking a drug. For example, the adverse event could be related to a disease that a patient already has, something in the environment, diet, or sleep habits, to name a few, could cause symptoms that could be misinterpreted as adverse events caused by a drug.
+ Is every adverse event reported with a drug on the dashboard caused by the drug?
Although it is difficult to generalize, it is unlikely that every adverse event reported for a given drug was caused by that drug.
The AEMS dashboard should not be used to determine the safety profile of one drug compared to another. Even identical drug products can have widely differing levels of adverse event monitoring due to the voluntary nature of the monitoring system.
+ How should reports of death be interpreted?
The same caution that applies to all of the AEMS reports, should be applied to death reports. The existence of a death report in the AEMS dashboard does not mean that the drug caused the person to die. Fatal outcome could be from the natural progression of the disease being treated.
+ Does the AEMS Dashboard have all the side effects that have occurred with a drug?
No. The AEMS database contains only a small fraction of the side effects that occur with a drug. This is due to a variety of reasons. Most importantly, there is no requirement for healthcare professionals and consumers to report side effects to either the FDA or to the manufacturer. Even for side effects that have been reported to the manufacturer, only certain categories of adverse events are required to be submitted to the FDA. Lastly, there are a variety of factors that can cause more or less reporting to both the FDA and manufacturers, including whether a particular side effect is known for a drug, how long a drug has been on the market and even whether there have been recent news reports about possible side effects for a given drug or a group of drugs.
+ What is the difference between an adverse event, a side effect, and an adverse drug reaction?
An adverse event (AE) is any symptom that occurs while taking a drug, which may or may not have been caused by the drug. This is different from an adverse drug reaction (ADR), where there is specific evidence that the AE is related to the drug. A side effect is the same as an ADR. As a result, ADR is always an AE, but an AE may or may not be an ADR.
+ Should I discontinue a prescription drug I’m taking if I think that it’s causing an adverse event?
You should always check with your healthcare provider before discontinuing any medication that you have been prescribed.
You should check with your healthcare provider if you have any concerns about a medication that you are taking. You and your healthcare provider should decide if the potential benefits of you taking a particular drug outweigh its potential risks as well as the risks of an illness being left untreated.
+ Where can I find the safety profile of the drug?
Please consult with your health care provider to discuss the safety profile and the overall benefit-safety balance of the drug.
The Home page displays the count of reports received each year and quarter by the FDA. This includes both initial and follow-ups reports submitted in AEMS.
In Q4 2021, the AEMS system was modernized and the data was migrated to a new database. The new database handles deletion of report submissions slightly differently compared to the previous system. Whenever a case is deleted, the previous system deleted only the latest follow-up report for the case and left the older reports in the case untouched. As a result, the counts displayed in the Home page included older reports for deleted cases. However, in the new AEMS database currently in use, all reports (initial and follow-ups) for a case are deleted upon the deletion of a case. Because of this, the counts of reports displayed in the Home page are now reduced compared to previous iterations of the AEMS Public Dashboard.
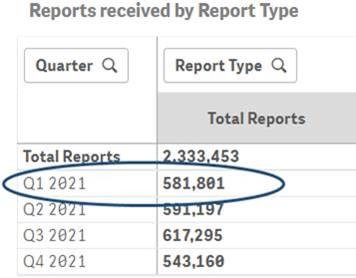
As an example, the comparison below highlights the difference in counts of reports for Q1 2021 before and after the data refresh for Q4 2021.
Q1 2021 report count before the data refresh for Q4 2021:
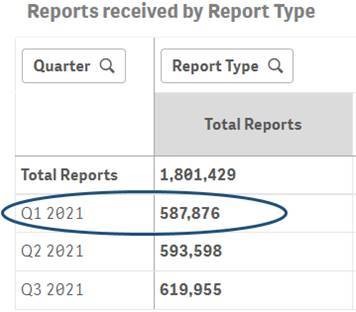
Q1 2021 report count after the data refresh for Q4 2021:
+ Which internet browsers can I use to access the dashboard?
You can use any of the following internet browsers to access and view the dashboard:
Microsoft Internet Explorer 11, Microsoft Edge, Google Chrome, Mozilla Firefox, Apple Safari.
+ What is the recommended screen resolution for viewing the dashboard?
For the best dashboard viewing experience, the recommended screen resolution for your desktop or laptop is 1920x1080.
+ How do I navigate through different sheets of the dashboard?
You may use the navigation bar on the top of the dashboard to navigate through different sheets. Depending on the sheet you are currently viewing, you may see different options to select in the navigation bar.
When viewing the “Home” or “Search” sheets, you will see the options shown below in the navigation bar.
![]()
When viewing any other page in the dashboard after searching for a product, you will see the options shown below.
![]()
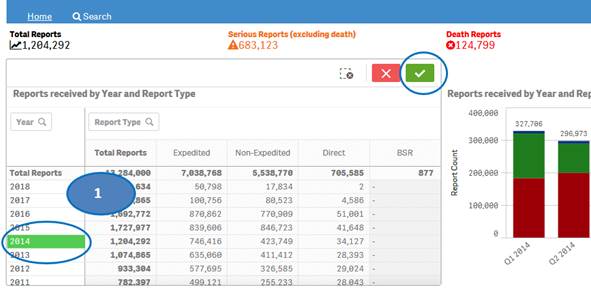
+ How can I view report statistics for quarters and months of a specific year?
The “Home” sheet displays report statistics for all the years by default. But you may view report statistics for quarters and months of any specific year. You can view statistics for quarters of only one year at time. You can view statistics for months of only one quarter at a time.
1. Click on any year in the table or chart and confirm selection to view statistics for the year by quarters.
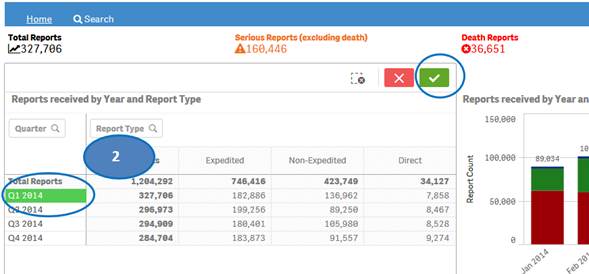
2. Then select any quarter by clicking on it to view statistics for the months of the selected quarter.
3. Clear the selected quarter to go back to view statistics by quarters.
4. Clear the year selection to go back to view statistics for all year.
Note: If a year has just one quarter of data, selecting the year will directly display months for the year without displaying quarters.
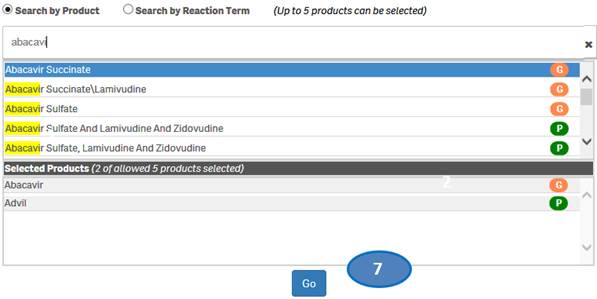
+ How do I search for cases for a product or products?
After accepting the disclaimer, click on the “Search” option and then:
1. Type a product value in the search bar.
2. Click or double-click on a desired value from the list of values to select it.
3. The selected product will be displayed under the list “Selected Products”.
4. To clear the search text, click on the ‘X’ button in the right corner of the search bar.
5. If you want to add more products to your search, repeat the steps above for the products you are interested in. You may select up to five products for your search.
6. If you want to deselect a product you have already selected, click or double-click on the product you want to deselect from the list “Selected Products”.
7. Once you have selected all the products you want to search for, click on the “Go” button.
Please note that you can select no more than five products at a time for your search.
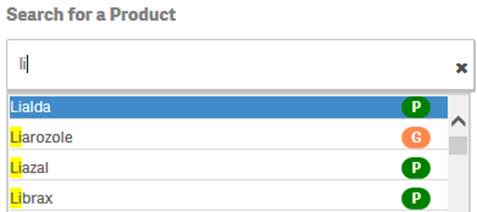
+ Can I search for generic products as well as specific trade names?
Yes. You can search for a generic product or a specific trade name by simply typing the name in the search bar. The search box pop-up includes icons to indicate whether a suggested product is a trade name or a generic product based on FDA’s internal product dictionary.
·
![]() indicates
that the suggested value is a product name or trade name.
indicates
that the suggested value is a product name or trade name.
·
![]() indicates
that the suggested value is a generic product.
indicates
that the suggested value is a generic product.
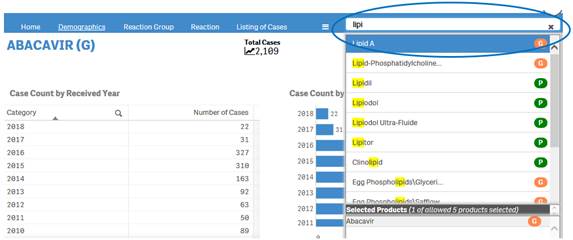
+ How can I change my product search?
If you have already done a product search, the navigation bar will display a search box where you can type in and select new products for your search.
+ Does AEMS include over-the-counter (OTC) or just prescription drugs?
AEMS includes both OTC and prescription drugs.
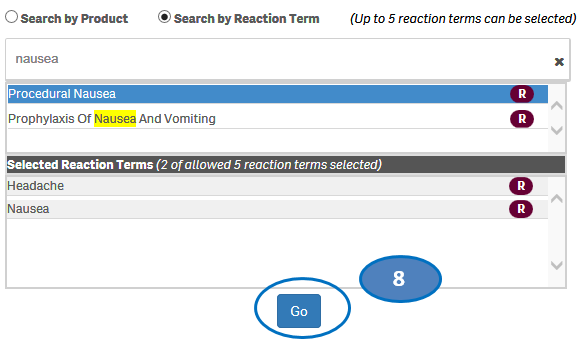
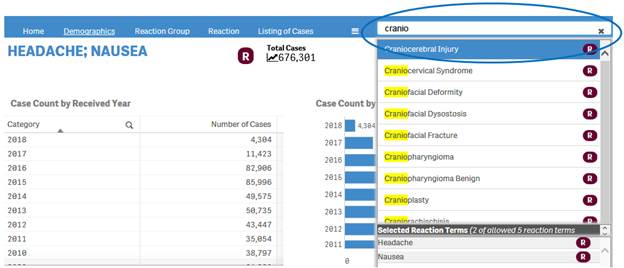
+ How can I search for cases for specific side effects/reactions?
From the “Home” sheet, click on the “Search” option and then:
1. Select option “Search by Reaction Term”.
2. Type a reaction term value in the search bar.
3. Click or double-click on a desired value from the list of values to select it.
4. The selected reaction term will be displayed under the list “Selected Reactions”.
5. To clear the search text, click on the ‘X’ button in the right corner of the search bar.
6. If you want to add more reactions to your search, repeat the steps above for the reactions you are interested in. You may select up to five reactions for your search.
7. If you want to deselect a reaction you have already selected, click or double-click on the reaction you want to deselect from the list “Selected Reactions”.
8. Once you have selected all the reactions you want to search for, click on the “Go” button.
Please note that you can select no more than five reaction terms at a time for your search.
+ How can I change my reaction search?
If you have already done a reaction search, the navigation bar will display a search box where you can type in and select new reactions for your search.
+ What can I search for using the search box in the navigation bar?
Depending on your initial search, you can use the search box in the navigation to search for either products or reactions terms.
If your initial search in the “Search” sheet was based on product(s), you can only search for products in the search box of the navigation bar.
If your initial search in the “Search” sheet was based on reaction term(s), you can only search for reaction terms in the search box of the navigation bar.
+ How many products or reactions can I search for at a time?
You can select up to five products or reactions at a time for a search.
Note: This restriction is applicable for products and reactions only. Multiple value selections can be made for all other data elements such as sex, country, and outcomes.
+ Does the “Search” sheet allow selecting products and reactions for the same search?
No, the search sheet allows you to select either products or reactions for your search but not both. For example, if you select specific products using the “Search by Product” option and then choose the “Search by Reaction Term” option, the products you have selected will be removed from the search.
You may, however, filter for products and reactions after your initial search in subsequent sheets.
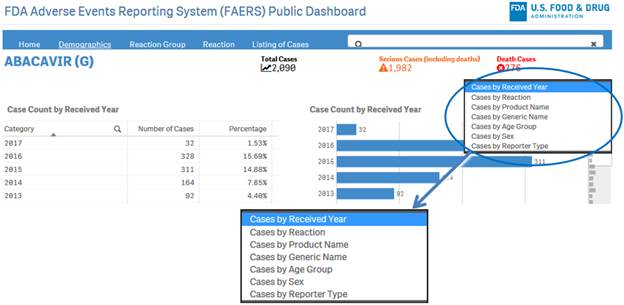
+ How can I view the distribution of report or case counts for different parameters?
To view distribution of counts for different parameters, click on the drop-down menu on the top right corner of a sheet and select the desired option.
+ Can I view charts and tables in full screen mode? How do I exit from full screen mode?
When you hover over any chart or table, a ![]() symbol
is displayed on the right top corner of the chart or table. Clicking on this
icon will enable you to view the chart or table in full screen mode. To exit
the full screen mode, click the X on the top right corner of the chart or
table.
symbol
is displayed on the right top corner of the chart or table. Clicking on this
icon will enable you to view the chart or table in full screen mode. To exit
the full screen mode, click the X on the top right corner of the chart or
table.
+ Can I filter data in charts and tables?
Yes, the dashboard provides extensive filtering capabilities on both charts and tables.
Note: When you apply filters on a table or chart within the “Home” sheet, the filters will be applied only on charts and tables in this sheet. Conversely, when you apply filters on tables or charts in any other sheet, after searching for a product, the filters will be applied on all sheets except for the “Home” sheet.
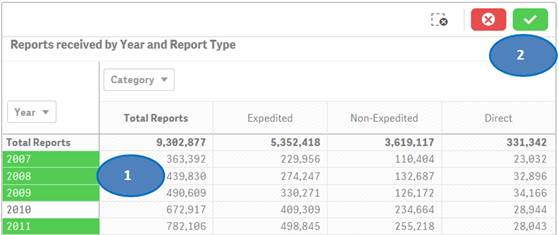
To filter data in a table, for example, filtering by year, there are two options:
Option 1:
1. Click on one or multiple columns or rows. You may also click and drag multiple rows or columns to select them for filtering data.
2. Click on the ![]() icon
to confirm your selection.
icon
to confirm your selection.
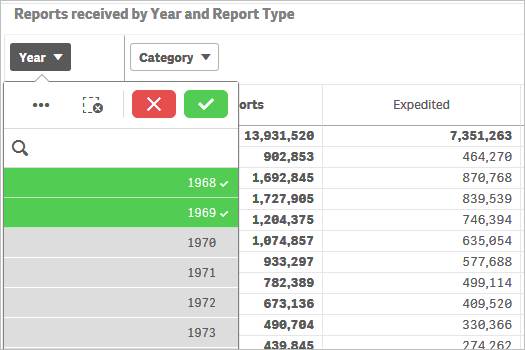
Option 2:
You may also use drop-downs (also known as filter panes) displayed on top of the rows or columns to choose your values for filtering. Please see screenshot below which shows how to select specific years for filtering.
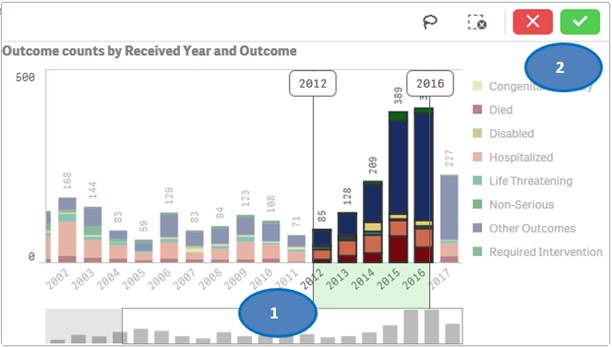
To filter data in a chart, for example, filtering by year, there are two options:
Option 1:
1. Click on one or multiple bars in the chart or items in the chart legend. You may also click and drag multiple bars to select them for filtering data.
2. Click on the ![]() button
to confirm your selection.
button
to confirm your selection.
Option 2:
You may also use “lasso selection tool” to select multiple values from the chart. To use this feature:
1. Click anywhere on the chart.
2. Click on the
lasso ![]() icon.
icon.
3. Click and drag to draw on the chart and select the bars you want to use for filtering.
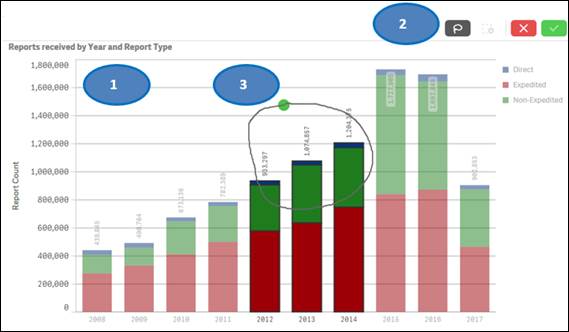
You may also select values from a chart’s legend for filtering by clicking on the values.
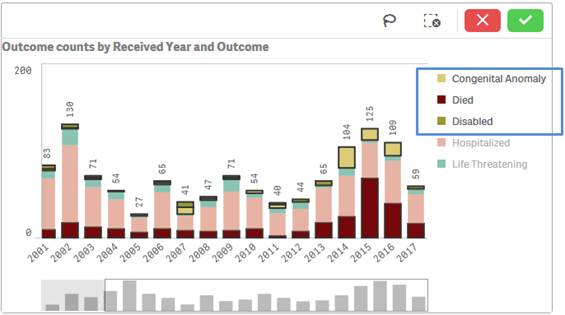
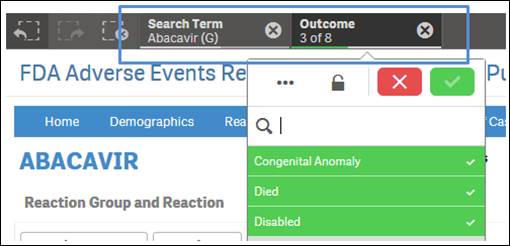
Note that the applied filters show up on the top selection bar.
+ How do I reset selected search criteria and remove all filters?
On the top left side of every sheet, you can see the icon shown below, with a dotted lined square with an “X” on it. Click the icon to clear any product you have selected for searching and all selected values used for filtering.
+ Can I extract or download dashboard data?
Yes, you may export or download dashboard data. Right-click on any table or chart in the dashboard and click on the “Export” option. You may choose from the following three options for exporting and downloading data:
1. Export as an image: This option will export a snapshot of the table or chart that you are viewing to an image file.
2. Export to PDF: This option will export a snapshot of the table or chart that you are viewing to a PDF file.
3. Export data: This option will export the underlying data of the table or chart that you are viewing to a Microsoft Excel (.xlsx) file. This option is explained in more detail in the final question of the FAQs below.
|
Action |
Color Code |
Description |
Screenshot |
|
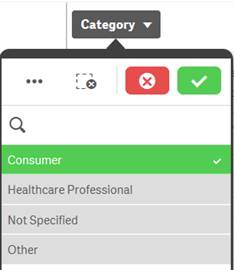
Selected |
Green, with a check mark as a selection indicator |
When you select one or more values in a filter pane and the values turn green, they are in the selected state. In the example screenshot, the value “Consumer” has been selected. |
|
|
Possible |
White |
In the screenshot of the “Category” filter pane for “Reporter Region”, the values “Domestic” and “Foreign” are white (possible), because selecting these values will return data. You could refine your data set by selecting one or more of these possible values. |
|
|
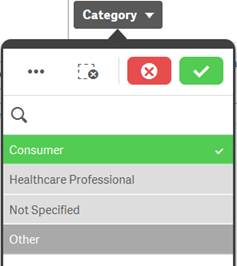
Alternative |
Light gray |
Selecting a light gray value will add to the previously selected value to broaden the filtering. |
|
|
Excluded |
Dark gray |
Dark gray value indicates that there is no data for the specific value based on other filters that have already been applied to the data. Caution: Selecting a dark gray value: · May clear some or all other existing filters and apply that value as the new filter. · May cause the selected product to be removed. If that happens, restart your search using the Search for Product option in the navigation bar. |
|


+ Can I use the dashboard without accepting the disclaimer?
No. You will not be able to view any data in the dashboard without accepting the disclaimer.
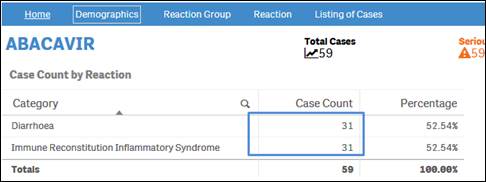
Each case might have more than one reaction term. Therefore, the sum of the case counts for individual reactions may be same or more than the total count of distinct cases.
+ Why does the sum of individual outcome counts not add up to the overall count for the product?
Each case might have more than one outcome. Therefore, the sum of counts for individual outcomes may not match the total count of distinct cases.
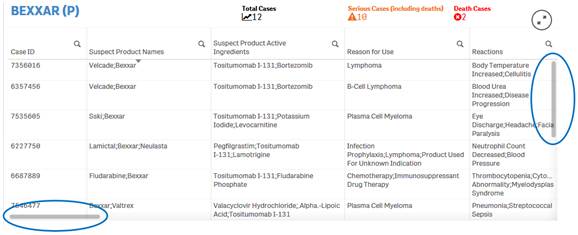
+ How do I scroll in the “Listing of Cases” table?
The “Listing of Cases” table allows you to scroll vertically or horizontally using vertical and horizontal scroll bars respectively. To view the scroll bars, hover over the listing of cases table.
· Scroll up or down in the Listing of Cases table using the vertical scroll bar on the right side of the table. This will allow you to see all the rows in the table.
· Scroll to the left or right in the Listing of Cases table using the horizontal scroll bar on the bottom of the table. This will allow you to see all the columns in the table.
+ Can I rearrange columns in the “Listing of Cases” table?
Yes, you may rearrange columns by dragging and dropping column headers anywhere in the table. To move a particular column:
1. Click and hold on the column header.
2. Drag it next to a column you want to move it to and release the click.
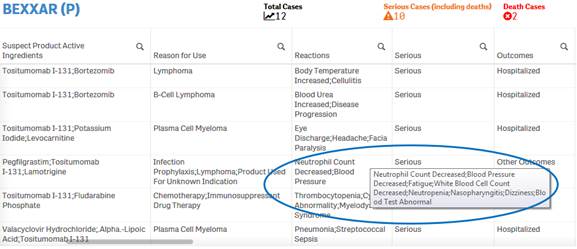
Due to space constraints, some cells display only partial data. To view the entire content of any cell, simply hover over the cell with your mouse. The entire content of the cell appears in a pop-up.
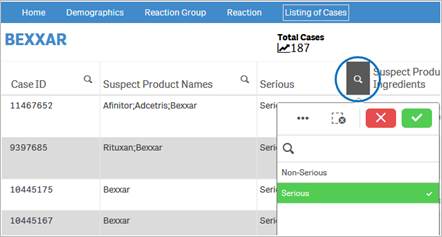
+ How do I filter and sort data in the “Listing of Cases” table?
You can filter and sort data in the table using any column or
any value in a cell. To filter using a value in cell, simply click on the cell.
The table is refreshed with the filtered data. To filter using a column, click
on the ![]() icon
next to the column header, and then select from the list of values for that
column.
icon
next to the column header, and then select from the list of values for that
column.
To sort data using a specific column, simply click on the column header. Click once on the column header to view data in ascending order. Click again on the column heading to sort the values in descending order.
+ How do I download data from the “Listing of Cases” table?
You can download data from the “Listing of Cases” table to a Microsoft Excel (.xlsx) file by using the “Export data” option.
Note: The “Listing of Cases” table provides a limited set of columns for case data. If you require a more comprehensive data set for download, you may download AEMS (FDA Adverse Events Monitoring System) Quarterly Data files.
The data displayed in the AEMS Public Dashboard may not be identical to the data in the AEMS Quarterly Data files due to several reasons. Please refer to the Data Questions section for more information.
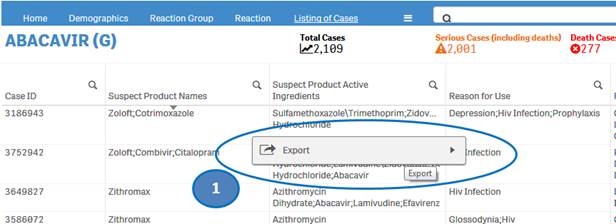
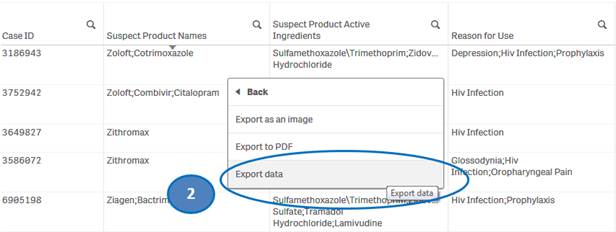
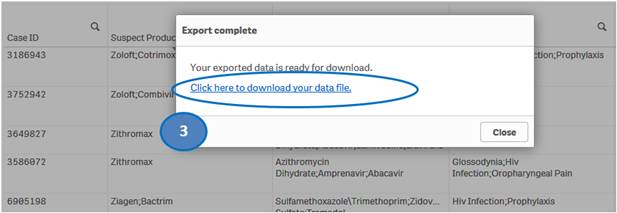
To download data from the “Listing of Cases” table:
1. Right-click anywhere on the “Listing of Cases” table and click on “Export”.
2. Select “Export data” option.
3. Then click on “Click here to download your data file” to save the file to your machine.
U.S. Department of Health and Human Services