
 U.S. Department of Health and Human Services
Food and Drug Administration
REMS Data are currently available through REMS@FDA for public access. To enhance communication of the FDA REMS Program to the public, FDA has developed a secure and user-friendly dashboard for REMS-related data retrieval and analysis as well as efficient report-generating capabilities. The REMS Dashboard is updated weekly.
After reviewing the User Manual and Frequently Asked Questions, if you have additional questions or feedback, please contact FDA’s Division of Drug Information at 301-796-3400 or druginfo@fda.hhs.gov
Frequently Asked Questions (FAQs)
Expand all | Collapse all
Risk Evaluation and Mitigation Strategy (REMS) is a drug safety program that the U.S. Food and Drug Administration (FDA) can require for certain medications with serious safety concerns beyond routine drug labeling to help ensure the benefits of the medication outweigh its risks. REMS are designed to reinforce medication use behaviors and actions that support the safe use of a medication. While all medications have labeling that informs health care stakeholders about medication risks, limited number of medications require a REMS.
REMS Dashboard is an analytical dashboard for the REMS data in Qlik Sense application. Qlik Sense is a business intelligence and visual analytics platform that supports a range of use cases, including centrally deployed, guided analytics apps and dashboards, custom and embedded analytics, and self-service visualization, all within a scalable, governed framework.
+ What information is available in the REMS Dashboard?
The REMS Dashboard includes information about approved REMS Programs such as Total REMS, Active REMS, Elements to Assure Safe Use (ETASU), Shared System REMS, Modifications, Revisions, and Released REMS.
+ What is the data source for the dashboard?
The data on REMS Dashboard are from the data source that supports REMS@FDA
+How often is the REMS Dashboard updated?
FDA updates the dashboard weekly.
+ What are the benefits of the REMS Dashboard?
FDA has approved more than 300 REMS programs and over 700 REMS modifications since 2008. The REMS dashboard was developed for efficient report generating capabilities, data retrieval, and analysis of REMS information. Availability of the dashboard for the public and other stakeholders including FDA staff allows for efficient access and visualization of the REMS data to improve transparency for the FDA drug safety programs.
+ Are there some limitations to the REMS dashboard?
The dashboard is limited to descriptive methods that is not intended for trend analysis or cross-comparisons. The data on the dashboard is limited to the accuracy of the data source that supports REMS@FDA
+ What is the optimal internet browser to access the dashboard?
Microsoft Edge, Google Chrome, and Apple Safari.
+ What is the recommended screen resolution for viewing the dashboard?
For the best dashboard viewing experience, the recommended screen resolution for your desktop or laptop is 1920x1080.
+ Is the REMS Dashboard accessible on an Android™ or iPhone®?
Yes, but the user interface layout may not be very user friendly. FDA will continue to work on the dashboard to make the user interface Android and iPhone friendly.
+ I am a new user, is there a user manual to help learn how to use the dashboard?
Yes, the user manual is available which includes the overview, and sample test cases of REMS dashboard.
+ Can I view charts and tables in full screen mode? How do I exit from full screen mode?
When the user hover over any chart or table, a ![]() symbol is displayed on the right top corner of the chart or table. Clicking on this icon will enable user to view the chart or table in full screen mode. To exit the full screen mode, click the X on the top right corner of the chart or table.
symbol is displayed on the right top corner of the chart or table. Clicking on this icon will enable user to view the chart or table in full screen mode. To exit the full screen mode, click the X on the top right corner of the chart or table.
+ Can I filter data in charts and tables?
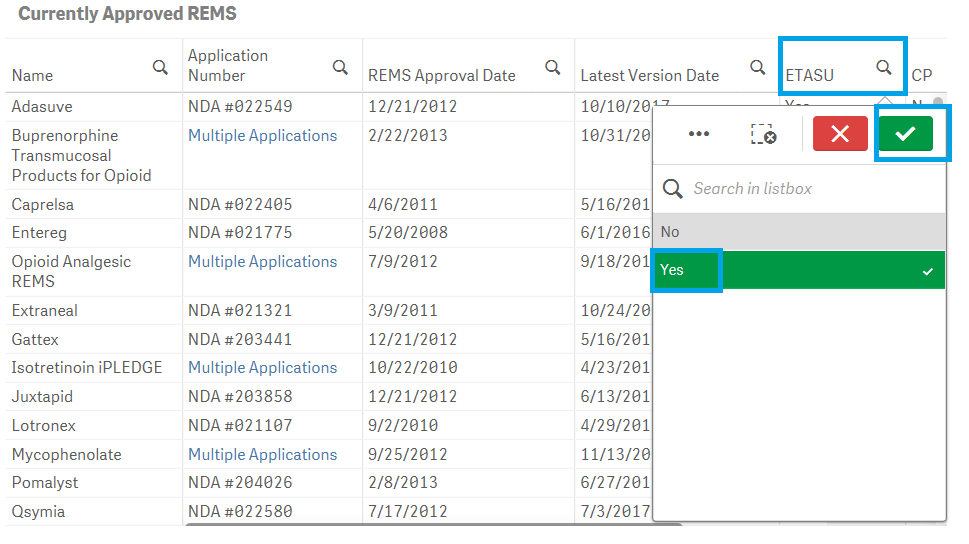
Yes, the dashboard provides extensive filtering capabilities on both charts and tables. To filter data in a table, for example, filtering by ETASU:
1. Click on one or multiple columns or rows. You may also click and drag multiple rows or columns to select them for filtering data.
2. Click on the ![]() icon to confirm your selection.
icon to confirm your selection.
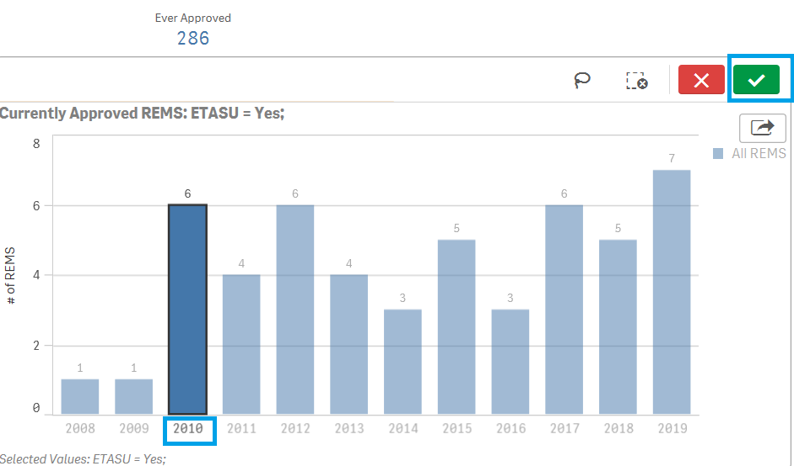
To filter data in a Bar Chart, for example, filtering by Year in ETASU page:
1. Click on one or multiple bar to filter the data of interest. You may also click on "lasso" ![]() to click or drag to select and filter the data of interest.
to click or drag to select and filter the data of interest.
2. Click on the ![]() icon to confirm your selection.
icon to confirm your selection.
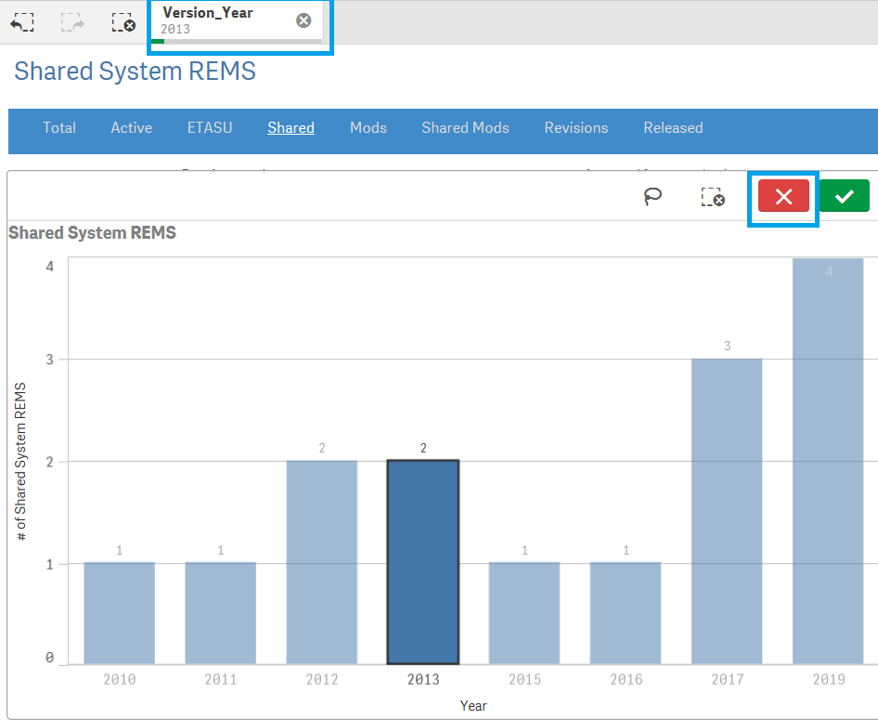
+ How do I reset selected search criteria and remove all filters?
If a user wishes to clear the filter, find the filter name from the Gray bar located on top of Blue selection bar and click [x].
Another way : when making the selection , user can also select red cross mark to clear the filter.
+ How I can download or export the results?
Some of the results from the dashboard can be exported or downloaded: Right-click on any table or chart in the dashboard and click on the “Export” option if available. You may choose from the following three options for exporting and downloading data:
1. Export as an image: exports a snapshot of the table or chart that you are viewing to an image file.
2. Export to PDF: exports a snapshot of the table or chart that you are viewing to a PDF file.
3. Export data: exports the underlying data of the table or chart that you are viewing to a Microsoft Excel (.xlsx) file.
For more details, please refer to User Manual-Section C: How to download data from the Bar graph and table.
+ What do the acronyms stand for?
| Acronym | Definition |
|---|---|
| ANDA | Abbreviated New Drug Application |
| BLA | Biologics License Application |
| CP | Communication Plan |
| ETASU | Elements to Assure Safe Use |
| EOY | End Of Year |
| FDA | Food and Drug Administration |
| BLA | Biologics License Application |
| KPI | Key Performance Indicator |
| MG | Medication Guide |
| MODS | Modifications |
| NDA | New Drug Application |
| REMS | Risk Evaluation and Mitigation Strategy |
| REMSID | REMS Identification |
| SS | Shared System |